Output Format#
All outputs are written under {storages.artifacts.filesystem.base_path}/{run_id}/.
Output Files#
Path |
Description |
|---|---|
|
Run metadata: resolved run date, sampling window |
|
Case data trimmed to the modelling window |
|
Weather features aligned to the modelling window |
|
Per-region threshold tables (both methods) |
|
Case and weather cutoff dates, prediction calendar |
|
District and state-level predictions |
|
Choropleth map images |
|
All map images bundled as a zip |
|
Structured report metadata |
|
LaTeX source and compiled PDF (if |
Predictions File#
Two prediction files are generated per run:
Predictions_{MonthRange}_District_{Date}.csv— district-levelPredictions_{MonthRange}_{State}_{Date}.csv— state-level aggregate
Example filenames:
Predictions_Apr - May 2026_District_20260407.csv
Predictions_Apr - May 2026_Karnataka_20260407.csv
District-Level Columns#
Column |
Type |
Description |
|---|---|---|
|
String |
Region identifier (e.g. |
|
Date |
Date of the prediction record ( |
|
Integer |
ISO week number |
|
String |
|
|
Float |
Historical mean of cases used for threshold |
|
Float |
Historical standard deviation |
|
Float |
Threshold tier 0 (baseline) |
|
Float |
Threshold tier 1 (elevated) |
|
Float |
Threshold tier 2 (high) |
|
Date |
Start of the predicted ISO week |
|
Date |
Date the prediction was computed |
|
String |
Region identifier (same as |
|
Float |
Predicted number of dengue cases |
|
String |
Model used ( |
|
Float |
Zone classification based on threshold tiers |
State-Level Columns#
Column |
Type |
Description |
|---|---|---|
|
Date |
Date prediction was computed |
|
Date |
Start of the predicted ISO week |
|
String |
State identifier (e.g. |
|
Float |
Predicted cases for the state |
|
String |
Threshold method used |
|
Integer |
Alert zone (0 = low, higher = elevated risk) |
|
String |
Model used for prediction |
Threshold Methods#
Two threshold methods are computed for each region and week:
historical — based on the mean and standard deviation of historical cases (configurable lookback via
thresholds.historical_n_years)previousNweeks — based on the mean of the most recent N weeks (configurable via
thresholds.n_weeks)
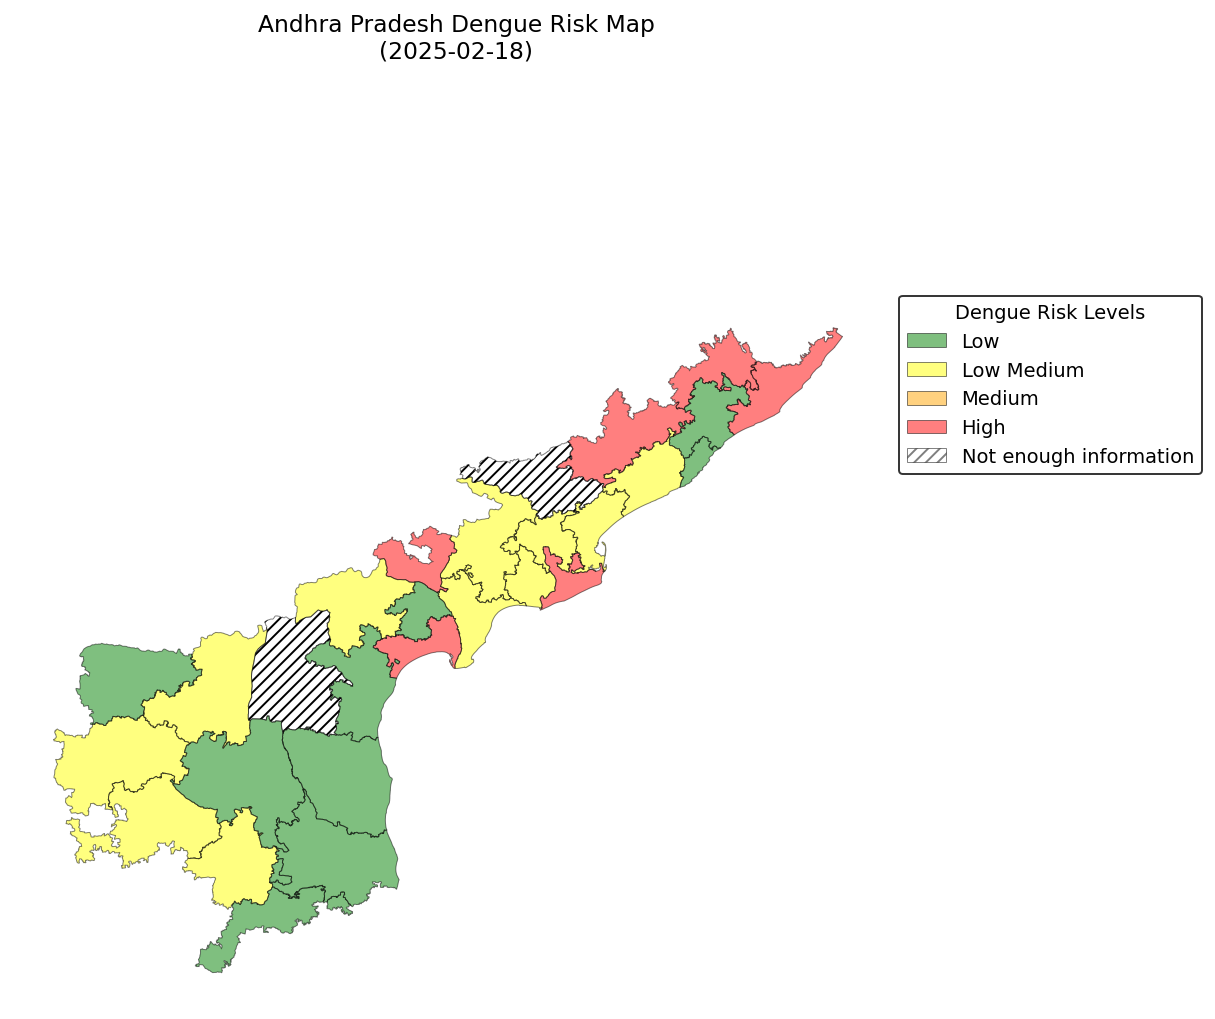
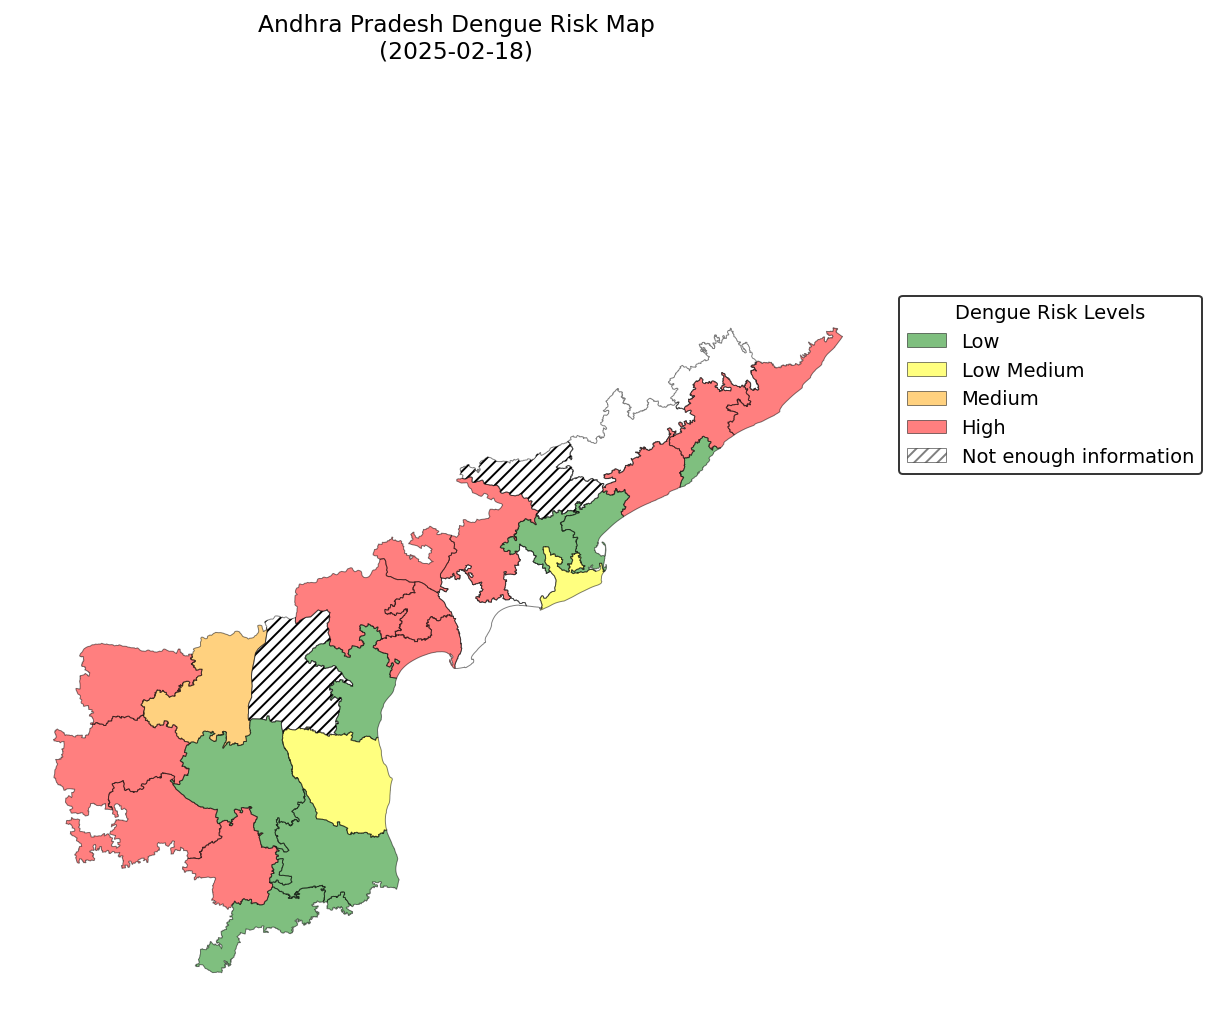
Example Maps#
The generate_maps step produces choropleth PNGs showing dengue risk levels per district. Below are two example outputs from the same prediction week (week of 2025-02-18, Andhra Pradesh), one for each threshold method:
Historical Thresholds
Previous N-Weeks Thresholds
Prediction Zones#
predictionZone is a numerical classification of risk:
Zone |
Meaning |
|---|---|
0 |
Prediction below T0 (low / baseline) |
1 |
Prediction between T0 and T1 (moderate) |
2 |
Prediction between T1 and T2 (elevated) |
3 |
Prediction above T2 (high) |